Bolingbrook Market Report · IL Home Values
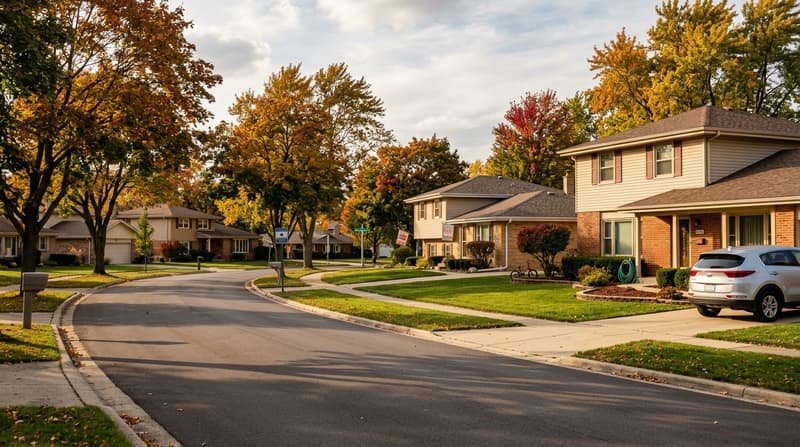
Bolingbrook, IL holds about 24,498 homes, with a median year built of 1989. Bolingbrook is in Will County. Most homes were built from 1970 to 1999. Single-family detached homes make up the housing. Subdivisions include Winston Village, Augusta Village, and River Hills. Downtown Naperville is about 20 minutes by car.
The Bolingbrook median sold price stands at $385,067, up 3.2% over 11 months. The twelve-month high was $405,000. 772 homes closed over the period, averaging 100.8% of list price most recently, with a median 47 days on market.
Read the trend, not the single month. Bolingbrook pricing follows preparation and seasonality more than it follows rate news, and the spread between prepared and unprepared homes is wider than the median suggests. A street-level read is a different number from the one above, and the table below is where it starts.
Data provided by Redfin, a national real estate brokerage, and the U.S. Census Bureau's American Community Survey.
Bolingbrook by the month
12 months of Bolingbrook closings. Each panel is one series; the table carries every figure.
Data provided by Redfin, a national real estate brokerage, and the U.S. Census Bureau's American Community Survey.
Twelve months of Bolingbrook closings
| Month | Median sold | Closed | New listings | Median days on market | List-to-sale |
|---|---|---|---|---|---|
| 11 months ago | $373,000 | 78 | 75 | 53 | 99.5% |
| 10 months ago | $369,900 | 73 | 64 | 56 | 99.1% |
| 9 months ago | $355,000 | 65 | 50 | 60 | 99.1% |
| 8 months ago | $355,000 | 50 | 45 | 60 | 99% |
| 7 months ago | $357,000 | 44 | 48 | 61 | 99.1% |
| 6 months ago | $375,000 | 45 | 64 | 57 | 100% |
| 5 months ago | $375,000 | 56 | 81 | 45 | 100.4% |
| 4 months ago | $398,066 | 67 | 88 | 43 | 100.9% |
| 3 months ago | $400,000 | 78 | 88 | 43 | 101.1% |
| 2 months ago | $405,000 | 77 | 90 | 43 | 101.3% |
| 1 month ago | $399,950 | 76 | 86 | 43 | 101.4% |
| Latest | $385,067 | 63 | 84 | 47 | 100.8% |
Data provided by Redfin, a national real estate brokerage, and the U.S. Census Bureau's American Community Survey.
What the Bolingbrook numbers say
The median Bolingbrook home sold for $385,067, up 3.2% from $373,000 eleven months earlier. The twelve-month high was $405,000.
The median home spent about seven weeks on the market and homes closed at 100.8% of list price. That is 6 days faster than eleven months earlier.
At the pace of the last three months, the 176 homes on the market in Bolingbrook represent about 2.4 months of supply: less than four months, which is the range where prepared homes tend to clear quickly and buyers have little room to wait.
Buyers have room to read a listing's history before writing, and a price that has sat is a price worth asking about. Sellers are getting close to their asking price, which usually means the price was set against recent comparable sales rather than against what neighbors are asking.
Data provided by Redfin, a national real estate brokerage, and the U.S. Census Bureau's American Community Survey.
Sold roundup
Recent Bolingbrook closings.


Talk to someone who works Bolingbrook
I have 2 years in these neighborhoods.