Oak Brook Market Report · IL Home Values
Oak Brook, IL holds about 3,373 homes, 91% of them owner-occupied, with a median year built of 1978. Expansive custom residences, private subdivisions, and modern condominiums define the residential market. Buyers evaluate substantial lot acreage and privacy against properties in nearby Elmhurst and Downers Grove. Purchasing strategies balance architectural scale against ongoing maintenance considerations. Offers focus on privacy and construction quality.
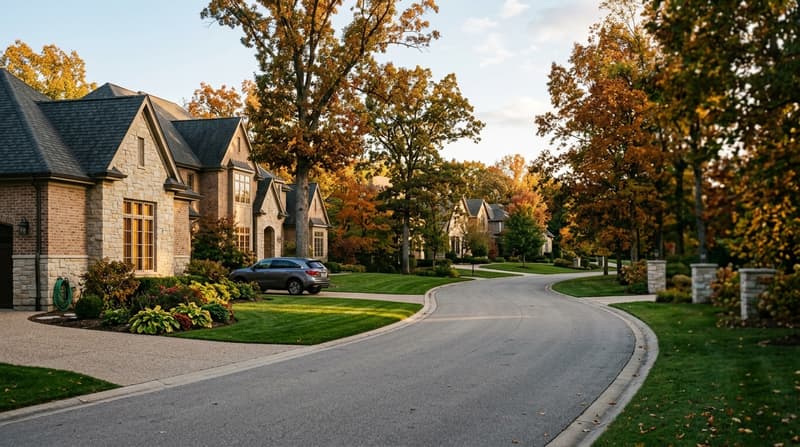
The Oak Brook median sold price stands at $1,400,000 as of May 2026, +25.6% year over year. The twelve-month peak was $1,400,000 in May 2026. 111 homes closed over the period, averaging 101.8% of list price most recently, with 48 days on market.
Read the trend, not the single month. Oak Brook pricing follows preparation and seasonality more than it follows rate news, and the spread between prepared and unprepared homes is wider than the median suggests. A street-level read is a different number from the one above, and the table below is where it starts.
Oak Brook by the month
12 months of Oak Brook closings, June 2025 through May 2026. Each panel is one series; the table carries every figure.
The properties shown here are transactions I personally represented, compiled from my public agent record. This site is not an MLS IDX feed and does not show the full active market; ask me and I will pull everything that fits.
Source: Redfin (through May 2026) · U.S. Census ACS (2024)
Twelve months of Oak Brook closings
| Month | Median sold | Closed | New listings | Avg DOM | List-to-sale |
|---|---|---|---|---|---|
| June 2025 | $1,115,000 | 12 | 11 | 60 | 96% |
| July 2025 | $950,000 | 12 | 13 | 67 | 103.2% |
| August 2025 | $1,050,000 | 11 | 12 | 98 | 94.8% |
| September 2025 | $1,065,000 | 11 | 8 | 69 | 96.7% |
| October 2025 | $860,000 | 21 | 12 | 62 | 96.6% |
| November 2025 | $970,000 | 8 | 7 | 65 | 94.1% |
| December 2025 | $1,080,000 | 9 | 4 | 130 | 96.6% |
| January 2026 | $870,000 | 7 | 8 | 59 | 96.9% |
| February 2026 | $932,500 | 4 | 6 | 105 | 96.2% |
| March 2026 | $1,050,000 | 5 | 12 | 70 | 95.1% |
| April 2026 | $1,325,000 | 6 | 12 | 56 | 96.4% |
| May 2026 | $1,400,000 | 5 | 10 | 48 | 101.8% |
The properties shown here are transactions I personally represented, compiled from my public agent record. This site is not an MLS IDX feed and does not show the full active market; ask me and I will pull everything that fits.
Source: Redfin (through May 2026) · U.S. Census ACS (2024)
What the Oak Brook numbers say
The median Oak Brook home sold for $1,400,000 in May 2026, up 25.6% from $1,115,000 in June 2025.
Homes averaged 48 days on the market and closed at 101.8% of list price in May 2026. That is 12 days faster than June 2025.
At the pace of the last three months, the 29 homes on the market in Oak Brook represent about 5.4 months of supply: between four and six months, which is the range where neither side has much of an edge.
Buyers have room to read a listing's history before writing, and a price that has sat is a price worth asking about. Sellers are getting close to their asking price, which usually means the price was set against recent comparable sales rather than against what neighbors are asking.
Source: Redfin (through May 2026) · U.S. Census ACS (2024)
Talk to someone who works Oak Brook
I have 2 years in these neighborhoods and answer personally.